In this series, we have covered many AWS services that can enhance your security posture in the AWS Cloud. In most of these, we have talked about how you gain visibility of any findings of interest. But what if you want a way a single way to monitor your AWS environment? In this final blog in our AWS Security Foundations series, we look at some of the overall monitoring solutions provided by AWS. We will also consider some third party options for closer to a “single pain of glass” experience!
AWS Security Hub
Security Hub was released at AWS’s first security conference re:Inforce in 2019. In fact, thanks to COVID-19, that was the first and so far only re:Inforce. May it return again one day!
Security Hub provides a simplified view of security findings from a bunch of AWS services. These include Amazon GuardDuty, Amazon Inspector, Amazon Macie, AWS IAM Access Analyzer, AWS Systems Manager and AWS Firewall Manager. Note that we have covered all of these services in previous blogs in this series. There are also a number of integrations with third party providers. For example, if you use Rapid7’s InsightVM for vulnerability management, you can push findings from it into Security Hub. Similarly, you can feed findings from Security Hub out to your security management platform, such as Sumologic.
Security Hub, like many other services, also works across AWS accounts. You can setup an account as the delegated master for an AWS Organization and see all the findings in one console! Super nice.
Setting up monitoring with AWS Security Hub
Getting start is very simple.
- Go to the Security Hub console. If you using a multi-account solution, make sure that you are in your Organization administrator (formerly master) account;
- Click on Go to Security Hub;
- Note the message about the requirement for Config. We enabled this earlier so we can ignore that. We recommend that the AWS Foundational Security Best Practices and CIS AWS Foundations Benchmark are enabled. If you need to have a PCI compliant environment, you can enable the PCI DSS standard as well;
- If you are in your Organization administrator account, provide the account ID as your delegated master account (best practice for a multi-account setup is to have a dedicated Security account) and click on Delegate;
- Click on Enable Security Hub to fire it up!
It will take a few hours for the data to be ingested and for findings to appear in the console. While this is happening, if you set up a delegated administrator, hop across to that account. In the Security Hub console, got to Settings. Select the other accounts in the Organization and in the Actions drop down select Add member. Very shortly, the accounts will be flagged as enabled. While you are there, turn on Auto-enable so that Security Hub monitoring is enabled for all new accounts.
Exploring findings
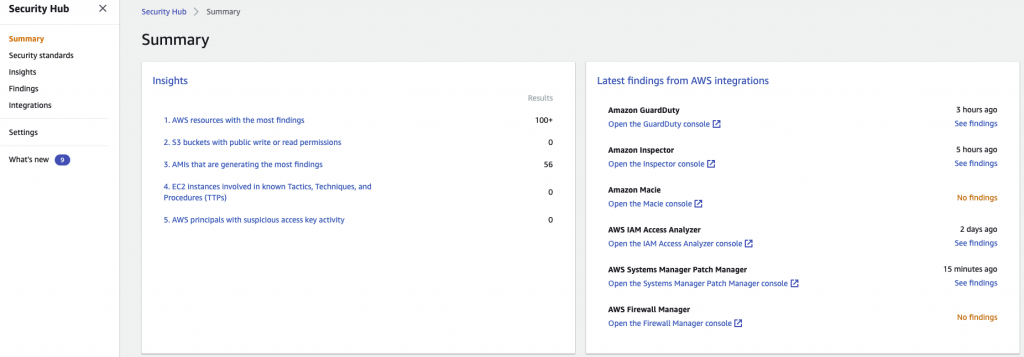
On the Summary screen you will see a high level view of findings, integrations and scores against the benchmarks. Explore the findings presented. Insights provides a number of built-in filters for exploring findings. You can also create your own filtered insight.
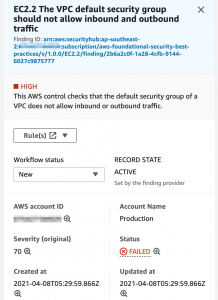
If you click on a finding, it will show you the details including links to remediation steps.
This is a familiar finding if you cast your mind back to the blog on AWS network security! If you scroll down it will show you the impacted resource(s) and a link to remediation details.
What if you don’t want to rely on looking at a the console? Maybe you want to be notified of any new or updated findings? Security Hub allows you to send findings pretty much wherever you want. Aside form the above mentioned third party integrations, all findings are automatically sent to Amazon EventBridge.
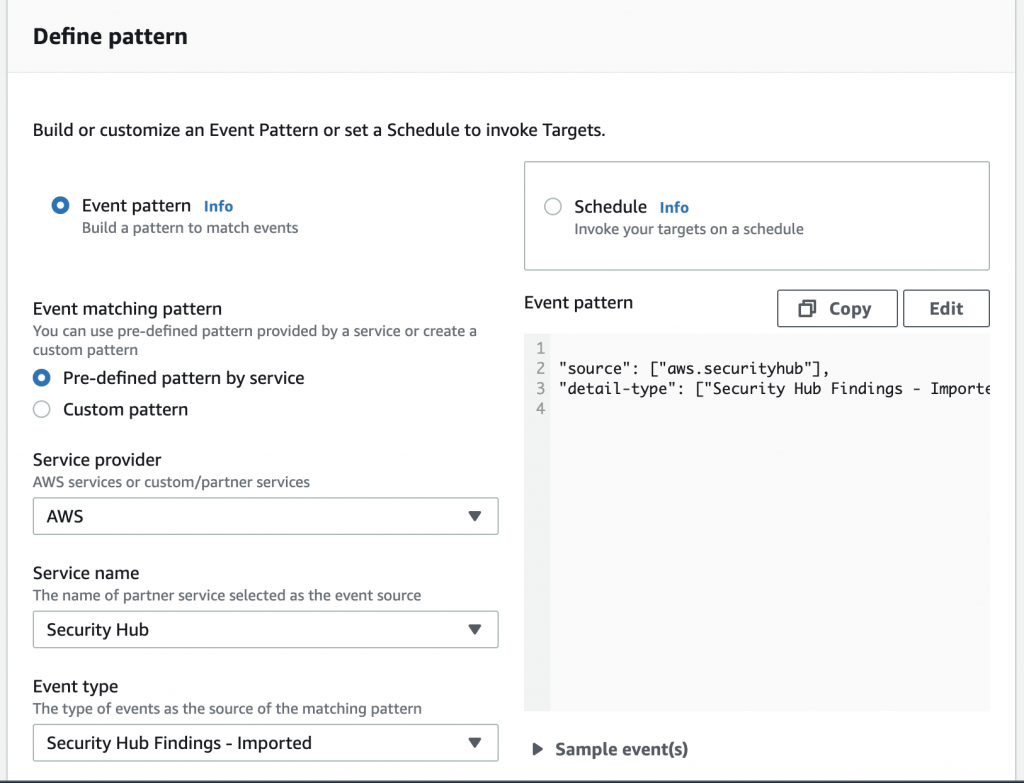
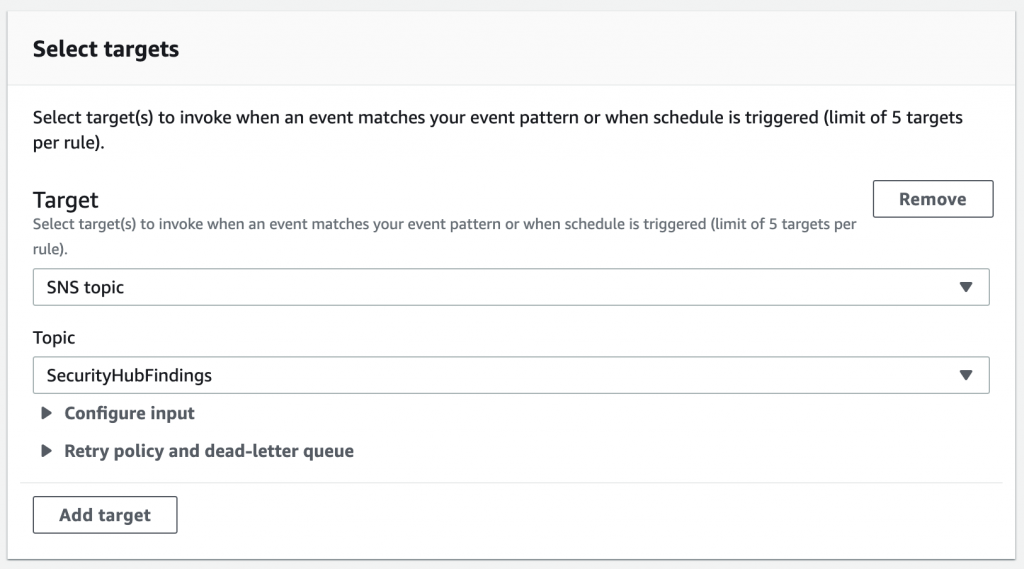
In the EventBridge console, setup a rule for the Security Hub findings. Fortunately it’s pretty easy as you can simply select AWS Security Hub as a pre-defined pattern. For event type, chose Security Hub Findings – Imported. You can set the rule to publish the findings to a variety of destinations. This includes CloudWatch, EC2 APIs, Lambda, SNS and Systems Manager to name a few.
In this case, we will push them to an SNS topic. We have configured this topic to send us an email for each of the findings.
Of course, we could use a Lambda function here to perform some remediation or enrichment action but that’s beyond the scope of a foundational discussion!
Amazon Detective
Security Hub is great for monitoring of your environments but what if you want to investigate events to determine the cause?
Amazon Detective was released last year and is evolving as a security analysis tool. Amazon Detective takes events from VPC Flow Logs, CloudTrail and GuardDuty. It provides the ability to determine interactions between events to identify the root cause. With Detective, for example, you can find all the events associated with a EC2 instance if you received an alert from GuardDuty.
Setting it up
Much like Security Hub, you can get it up and running in a few minutes. From the Detective console, click on Get started followed by Enable Amazon Detective. For a single account, that’s it!
Like many other services, you can enabled monitoring across multiple accounts for Detective. While Detective doesn’t use the term “delegated administrator”, we can effectively set this up by inviting other accounts. As previously mentioned, we recommend using a dedicated Security AWS account. Note that to get the best out of Detective, your Security account should be the master for Detective, GuardDuty and Security Hub. This will allow you to pivot between the services.
Adding other accounts to Detective is not as seamless as other services! It doesn’t automatically show your other accounts in the Organization and allow you to just add them. You have to provide the list of account numbers and email addresses. Each account will then be sent an invitation. You will then need to log into the member account and accept the invitation from the Detective console. After this step, you are ready to go! New accounts will need to be invited using the same process. They won’t be automatically added. It’s a little clunky but it’s a one-time activity per account!
It will take a while to ingest the data. Time to go get a coffee.
Using Detective
Let’s run through an example of how we can use Detective to investigate an observed event.
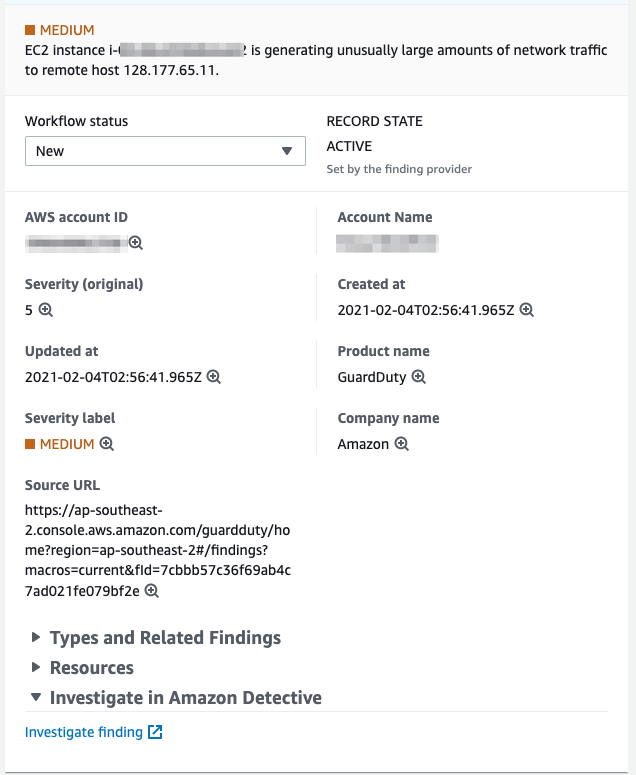
We start our monitoring in Security Hub where we have a finding related to a EC2 instance. GuardDuty has reported an unusual level of traffic to a remote host. We can see the details of the event in Security Hub
From Security Hub, we Investigate in Amazon Detective by clicking on the Investigate finding option at the bottom the detail page.
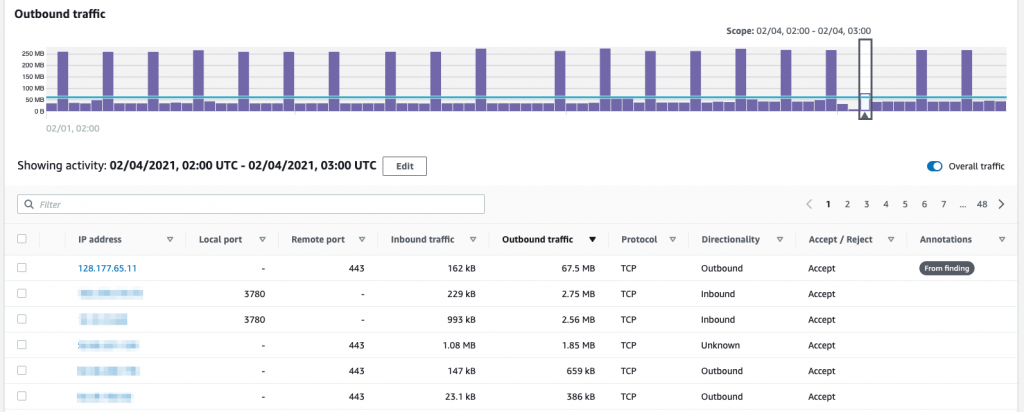
Scroll down in the Detective window and we see the network flow details. In the Outbound traffic graph, we click on the highlighted time window from the finding and sort the table by outbound traffic. We can see the large volume to the flagged IP address.
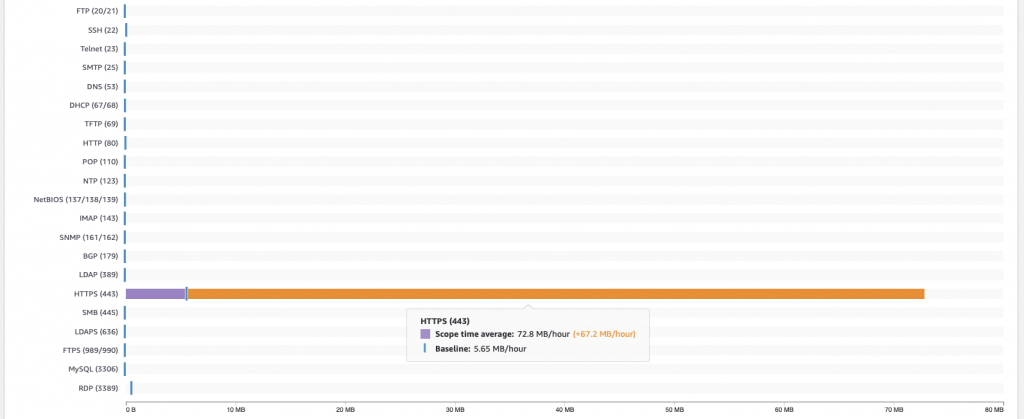
If we click on the VPC flow details tab we can look at the average outbound flow by protocol. We can see the amount of traffic compared to the average. In this case, it’s all HTTPS traffic to the identified IP.
Back on the Overview page, we can gain some more information related to the IP and instance ID by clicking on the respective value. If we click on the instance ID, it will show the related API activity (from CloudTrail) for that instance under the New behaviour tab. This includes any changes in behaviour which are important security signals. We can also click on the IPs associated with the instance to determine any interactions.
Enriching data
It all gives a good overall picture of related behaviour but it’s definitely missing some further data enrichment. If we do a reverse DNS lookup, we see that the IP belongs to support.rapid7.com. Looking at the instance, we see that the tags on it tell us that the instance is a Rapid7 InsightVM scanner so we are now pretty sure that this is a false positive. Just to be sure, we check the IP in a threat feed and check the DNS record via an online tool.
We can now close the investigation and mark the finding as resolved.
Seeing it all
If you want monitoring across all the AWS services, then neither Security Hub or Detective currently provide that. You will need to look at either building something yourself (potentially using CloudWatch and EventBridge) or use a third party log aggregation and security management system.
Don’t build it yourself!
Many options are out there that you can consume as a service. We use Sumologic for dashboards and alerting in combination with Lambda for data enrichment. The advantage of using a proven solution is that you can concentrate on your data and alerts and not worry about the underlying machine. You can also use this data to present business level data or manage availability and performance in the same platform!
If you primarily interesting in monitoring and managing your compliance and configuration, then both DivvyCloud and CloudConformity are recommended.
Wrapping up
Having the ability to monitor and investigate events is key to staying secure. It starts with having the services and data in place. Then you need to have a way to see (and preferably be notified of) findings. Security Hub is a great place to start.
If you want to understand more about monitoring your AWS environment, please get in contact with us at RedBear.
